
The ability to image, extract, and study cells and their subcellular structures is crucial to several research areas and is a driver of advances in biology, medicine and drug discovery. Cellular dynamics that are characterized in normal and pathologic conditions continue to enhance our understanding of basic biological processes in addition to accelerating drug discovery.
Recently, breakthroughs in high-resolution fluorescent microscopy have enabled detailed visualization of cells and their subcellular components. Coupled with more compute power and new algorithms in machine learning and computer vision, cell segmentation has become a lot more efficient and accurate.
Cell segmentation, or identifying cells in an image, has emerged in the past few years as a commonly used technique crucial for image-based cell biology research.
Using cell segmentation, scientists are able to analyze relevant biological features such as cell count, type, division, shape, etc. Scientists can quickly evaluate how these features change over time and in response to a variety of conditions.
These insights can drive drug discovery, diagnostics, and other important fields of biology, pharmacology, and personalized medicine.
In this article, we will walk through the following topics to give you an idea of what cell segmentation is and how you can start using it for your use case:
- How Cell Segmentation Works
- Logistical Considerations
- Free Solutions
- Paid Solutions
- Biodock's Cell Segmentation Solution
Let's dive in!
How Cell Segmentation Works
Scope of This Article
Oftentimes, the term cell segmentation has been used to refer to the segmentation of the cell nuclei (nuclear segmentation) as opposed to segmenting the entire cell body including the cytoplasm (nuclear + cytoplasmic segmentation). In the latter method, one might focus on whole-cell segmentation in the 2D microscopy images where the cytoplasm appears bright, the background is dark, and the nucleus has little or no staining. This article, however, will not discuss other medical/structural segmentation.
The 2-D Cell Segmentation Task
The cell segmentation task localizes cell object boundaries in an image and distinguishes these object boundaries from the background of the image. Known as pixel-wise binary classification, a mask with exactly the pixels that belong to each region of interest is inferred.
Semantic Segmentation vs Instance Segmentation
Segmentation methods based on pixel-wise classification can be roughly divided into two categories: semantic segmentation and instance segmentation.
The main difference between these two is that in semantic segmentation a pixel-level classification is performed directly, while in instance segmentation approaches an additional object detection step is needed to obtain the individual instances of all classes in an image. Instance segmentation allows users to not only segment the region of interest from the original image but also to classify what that region of interest is (e.g. bacteria, phyla, virus, a nucleus, etc).
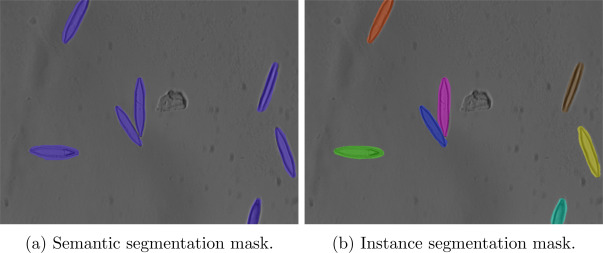
In Figure 1 above, we see an output mask example for each method.
The semantic segmentation performs a pixel-level classification, so we see that only one mask for the whole image is generated. Furthermore, individual instances of each class cannot be distinguished.
Meanwhile, when instance segmentation is applied we see an individual mask for each chair so that individual instances of chairs can be processed separately.
Setting Intensity Thresholds
Cell segmentation models achieve the goal of pixel-wise binary classification by setting intensity thresholds for an image and using the min and max thresholds (0-255 on the RGB scale) to classify the pixels in an image as cell objects or background.

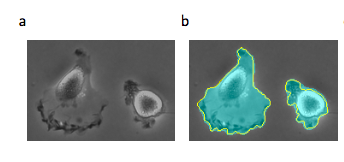
In Figure 2, we see a slightly different use case exemplifying these same principles. We can analyze these fluorescent images of cell growth over time to identify the size of the colony at each point in time. A simple threshold intensity can be used to identify the cells in the image since we know pixels containing cells have a higher intensity (closer to 255 RGB value) than the dark background (closer to 0 RGB value).
Classical Imaging Techniques for Cell Segmentation
Although there is an abundance of segmentation methods that exist, accurate segmentation is demanding and generally will require problem-specific tailoring of algorithms. We will first focus on a few imaging techniques that use the gradient field of the image to detect cell boundaries.
- Watershed segmentation: A watershed is a transformation defined on a grayscale image. In watershed segmentation, the algorithm treats image pixel values of an image as a topographic landscape with ridges and valleys, starting from user-defined markers. The landscape’s elevation values are usually defined by either the gray values of the respective pixels or their gradient magnitude. Based on this 3D representation the watershed transform deconstructs an image into catchment basins. The algorithm floods basins from the markers until basins allocated to different markers meet on watershed lines.
- Morphological image processing: The binary regions created by simple thresholding are distorted by noise and texture. Morphological image processing is a collection of non-linear operations related to the relative ordering of pixel values as opposed to their numerical pixel values. By accounting for the form and structure of the image, morphological image processing is particularly suited to the processing of binary images with numerous imperfections.
- Laplacian of Gaussian (LoG) filters: The Laplacian of an image, a 2-D isotropic measure of the 2nd spatial derivative of an image, is frequently used for edge detection since it underscores regions of rapid intensity change in an image. First, to reduce an image’s sensitivity to noise, it is smoothed with something approximating a Gaussian smoothing filter. This normally takes a single gray-level image as input and produces another gray-level image as output.
- Pixel classification: Pixel cell classification utilizes local image intensity histograms and Bayesian probability rules that treat the intensity values for each pixel as an independent variable. This technique classifies each pixel independently based on its local properties, and is unaware whether the resulting set of pixels forms connected regions or continuous edges. The use of pixel classification is suitable when handling irregularly-shaped zones and when the feature extraction and classifier extraction are not too demanding from the computational point of view.
AI Imaging Techniques for Cell Segmentation
Click here to follow the state of the art in instance segmentation over the past 5 years (note: this is not equal to the state of the art in cell segmentation).
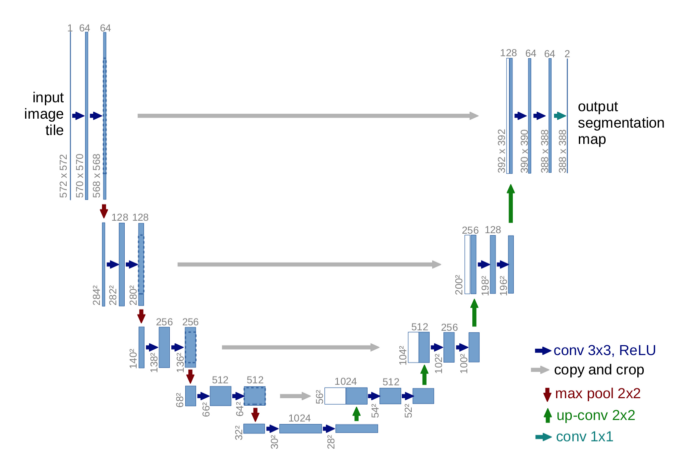
- U-Net: U-Net is a generic deep-learning solution for frequently occurring quantification tasks such as cell detection and shape measurements in biomedical image data. It is an end-to-end fully convolutional network (FCN) that can accept images of any size. On a high level, the encoder is first used to capture the context in the image, after which the decoder is used to enable precise localization using transposed convolutions. (click here for an in-depth tutorial of semantic segmentation with U-Net)
- Mask R-CNN: Mask R-CNN is a simple and flexible framework for object instance segmentation, developed on top of Faster R-CNN. This easy-to-train solution efficiently detects objects in an image while simultaneously generating a high-quality segmentation mask for each instance. On a high level, a selective search is first used to extract candidate regions from the image (known as region proposals), after which Mask R-CNN classifies the proposed regions and generates bounding boxes and masks.
Logistical Considerations
There are several crucial logistical parameters to cell segmentation solutions. We will start by defining these parameters:
- Time: How long does it take for a scientist to perform cell segmentation analysis? Some analysis methods take longer to get used to and the time required to implement should also be weighed against the time needed to correct. If a certain standard of accuracy is desired, it may take longer to tweak parameters and correct images by hand, even if the implementation is faster.
- Software Performance: Imaging techniques have varying levels of noise and precision of thresholds. Generally, performance increases as we move from simple classical methods to better classical methods to AI models. The difference may be drastic if your images are more complex.
- Cost: Time spent manually drawing regions around cells or using outdated classical segmentation techniques slows down the research cycle, meaning that it takes a lot more time and money to create potentially lifesaving cures. Like many Software-as-a-Service (SaaS) models, companies oftentimes split users into either a free or premium (paid) tier, giving free users limited access to product features while premium users gain greater access to features. While there are several free solutions available for classical methods of cell segmentation, many pre-trained AI models can be expensive.
- Ease of Use: The user interface of cell segmentation software tends to consist of ways of uploading images, performing segmentation analysis, and finally creating population groups using the software’s gating tools. Simple classical methods of segmentation are the easiest to use, and have been tried and tested for 50 years. Meanwhile, AI models are difficult to train, and require lots of image data to achieve high accuracy in addition to coding experience.
- Analysis Speed: Certain imaging techniques can increase the speed of cell segmentation analysis. For example, spectral clustering on local image histograms cuts the time to do pixel-level cell classification by calculating similarity matrices between large groupings of image clusters. Furthermore, distributed deep-learning infrastructures can speed up cell segmentation analysis by splitting up segmentation jobs across the cloud. Generally, analysis speed increases as we move from classical methods to AI methods of segmentation.
- Parameter Tuning: Classical methods require more parameters while AI models can usually generalize. Classical methods of cell segmentation require more parameters while AI models can usually generalize. This can also be a con, however, as there is often no easy way to tune knobs and get better performance.
| Simple classical methods (ex. histogram or thresholding) |
Better classical methods (ex. watershed) |
AI models (ex. Mask R-CNN) |
|
|---|---|---|---|
| Time | Fast if only low accuracy needed |
Much slower than simple classical methods | Takes a while to train and implement, fast once model is trained |
| Software Performance | Not very accurate | More accurate | Most accurate by far with a good model |
| Cost | Many free solutions available | Many free implementations available | Design model and train yourself or may be very expensive |
| Ease of Use | Usually out-of-the-box, largest community with experience | Simple, can find implementations online - may require coding experience | May be more difficult for scientists, even in a commercial product |
| Analysis Speed | Fastest, generally few scaling issues | Slow, may run into major scaling issues | Requires specialized GPU infrastructure to scale |
| Scalability | Many free programs available | Many free programs available | Code and train yourself or can be very expensive |
| Parameter Tuning | Requires few parameters | Requires more parameters | Can usually generalize parameters - much less tuning |
Free Solutions
Segmenting Your Images Yourself
If you choose to segment cell images yourself, you can write your own script with Python in just a few quick and easy steps. Many of the imaging techniques discussed above have open-source implementations available online.
Let’s start with a simple example of watershed segmentation. Scikit-image, a Python package dedicated to image processing, walks through a full script of watershed segmentation here.
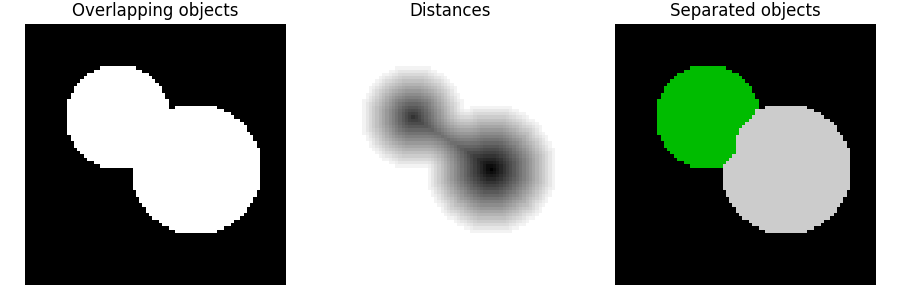
Three main takeaways from the tutorial linked above:
- To separate the objects in the image, generate the markers as local maxima of the distance to the background.
- The flooding of basins from such markers separates the two circles along a watershed line.
- Generate your class labels using the
skimage.segmentation.watershedmethod
For the AI techniques mentioned above, creating your own algorithm is more involved. A full tutorial on nucleus segmentation using U-Net can be found here.
Four key takeaways from the tutorial linked above:
- Use a high-level library like
Pytorch,Tensorflow, orKeras. - Make sure you separate your data into train, validation and test splits.
- Use a GPU or multiple GPUs on AWS EC2, Google Colab, or Google Cloud to process more quickly.
- Benchmark results against state-of-the-art and iterate often.
Free Cell Segmentation Services
There are a variety of free cell segmentation softwares. Generally, these free softwares offer easy-to-use gating and statistical tools and are quite flexible and usable in independent analysis. However, they are generally not as powerful and their platforms are not end-to-end, as most require upgrades to unlock additional image analysis features.
Here are some guides for getting started:
Fiji is reasonably powerful for classical analysis, and although it has a learning curve, is familiar to many academics. This has made it the default image analysis program of choice for many labs.
CellProfiler is flexible and usable in independent analysis. It is great for batch processing and gives its users the ability to create an output vector which can act like a barcode for each cell.
Icy has a very familiar feel to anybody that’s used Microsoft Word, with a ribbon menu that organizes Icy’s features into a series of tabs at the top of the window. Additionally, all tools are available in the same window, so users can see everything in a dashboard view.
QuPath was greatly influenced by ImageJ and Fiji, and adds many of its capabilities to pathology. While you can use QuPath on its own, you can also use it in tandem with ImageJ by exchanging data between the two of them to get the best of both together.
- Getting Started with ZEISS ZEN (blue edition) and Leica Tutorial
ZEISS and Leica are first and foremost microscope manufacturers with software solutions that are well connected with their microscopes. This allows them to control functionality for image acquisition, elementary image processing, and annotations. These softwares generally have better metadata linking from their own proprietary file formats.
Paid Solutions
There are several paid cell segmentation softwares. Generally, these paid softwares are quite flexible and usable in independent analysis. However, most require upgrades to unlock additional image analysis features and can be pricey.
Here are some paid solutions:
HALO is used primarily for quantitative tissue analysis in digital pathology. It's especially known for its usability, and has several add-ons you can buy to do more specialized analysis.
Visiopharm's software is known to be very powerful and offer a wide feature set. It is also quite expensive and has a steeper learning curve than other solutions.
Volocity is designed for 3D analysis of microscope images. This software allows you to view cells from every angle, as Volocity Visualization provides rapid, interactive, high-resolution volume rendering of multichannel 3D and 4D data sets.
The Imaris for Cell Biologists package is best for researchers in life science disciplines who require a wide range of functionalities to study cells and organisms. Imaris allows for easy customization with language extensions.
Biodock Cell Segmentation Solution
Biodock uses pre-trained AI to make cell segmentation painless. We manage your storage for you and run jobs in the cloud so you don’t have to worry about infrastructure - everything is run in parallel on cloud GPUs! We’ve trained on thousands of samples and we’ve built out a user interface specifically for scientists that’s very easy to use. Best of all, if you're an academic user, we have a generous free plan to support your research with the best end-to-end analysis software.