
Over two centuries ago Lewis and Clark embarked on an expedition to map the western United States. Charting landscapes and routes in between, their adventure into this unknown territory revolutionized the country’s identity and presence. Our brain constitutes a map too, consisting of over one hundred billion neurons who collectively form trillions of synaptic connections. From this inner world emerges our thoughts, memories, and sensations. While Lewis and Clark ventured outward, neuroscientists today venture inward as cartographers of the mind. Synapse by synapse, they undertake the most ambitious cartographic feat: to map all the connections in the brain. The map is called the connectome, and the effort to obtain it is called connectomics.
The first completed connectome was from a small worm named Caenorhabditis elegans. In 1984, Sydney Brenner and his group submitted their work, affectionately entitled “The mind of a worm”. In it, the authors describe the cell types, connections, and morphology of 302 neurons and nearly 8,000 synapses. However, mapping the connectome of C. elegans took thousands of painstaking hours as imaging and annotations were performed manually. Our brains contain hundreds of millions of times more neurons and unfathomably more connections. How can we close this seemingly insurmountable gap? Here, I will discuss how advancements in microscopy are being synergized with artificial intelligence (AI) to map the connectomes of more complex brains.
Table of contents:
1. How can we map connectomes?
a. Slicing and imaging
b. Automated image analysis
2. How are connectomes enhancing our understanding of the brain?
3. The road ahead: scaling and speeding up
How can we map connectomes?
Slicing and imaging
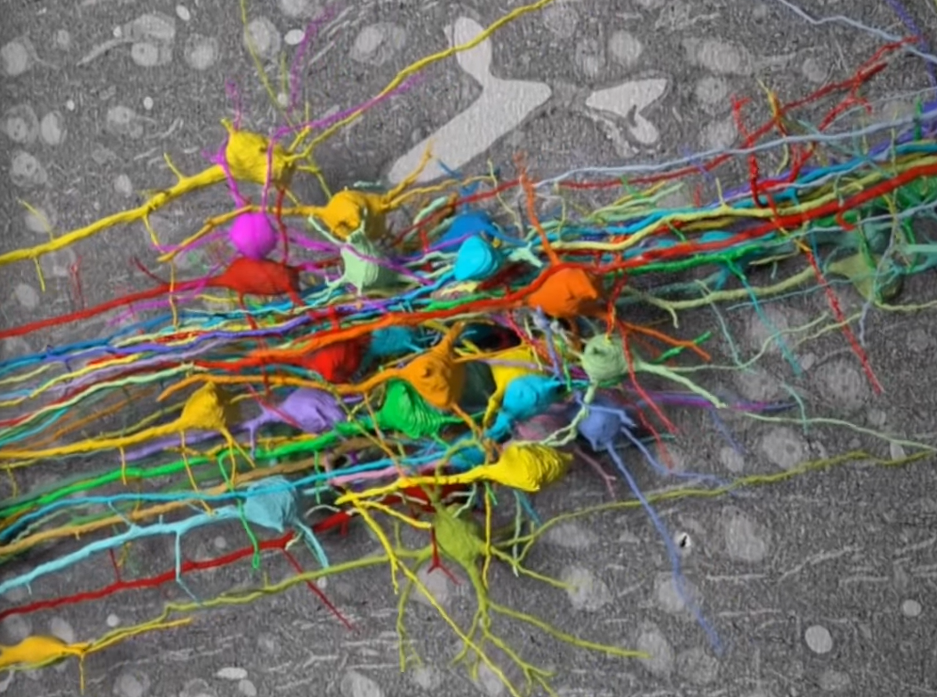
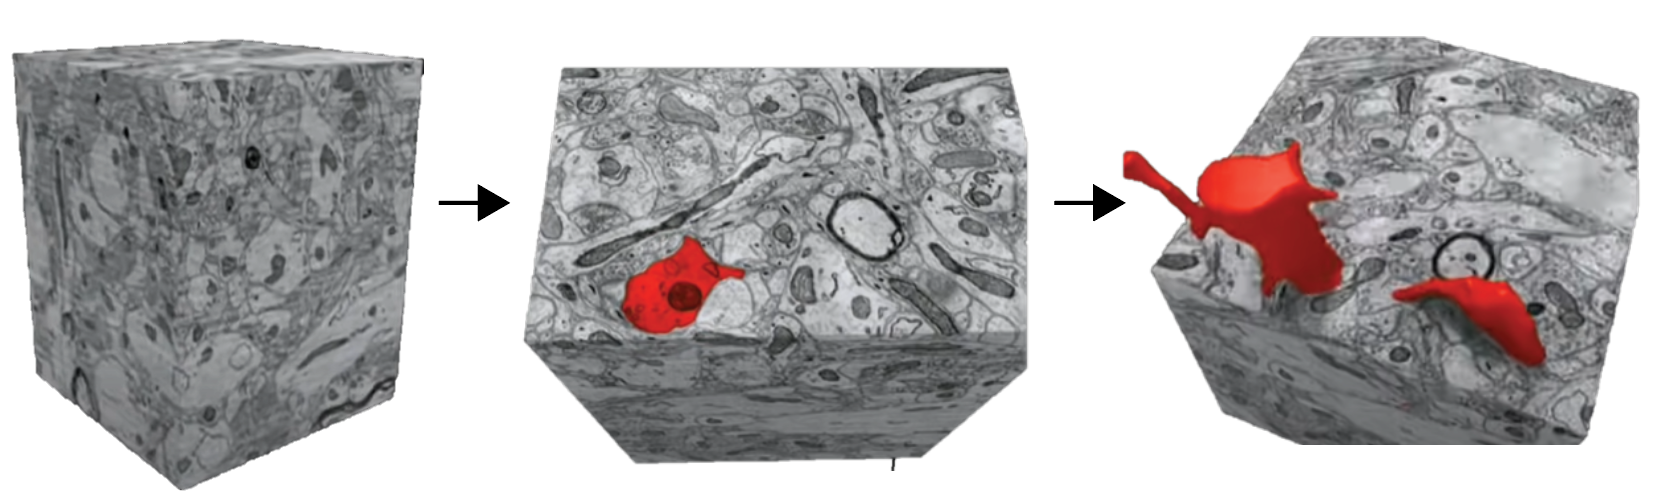
When a baker is making tall and complex art out of cake, they will stack sheets of cake and carve into it. If you were to then go back after the final product is complete and disassemble all the sheets, each layer would be unique and carry certain aspects of the cake accordant with its order in the assembly. The fundamental approach to obtain connectomes functions similarly. The brain can be sliced into extremely thin sections, each containing elements of neuronal and cellular structures. These structures can then be ‘carved out’ in each slice and reassembled computationally to obtain a three-dimensional structure (Figure 1). Once the three-dimensional neuronal structure is resolved, specialized cellular components such as synapses can be identified and assigned to the neuron it belongs to. This results in obtaining the general architecture of the neurons in the brain and the connections between them.
Although this is simple in principle, it requires images high enough in resolution to identify cellular features such as the plasma membrane, synaptic cleft, and vesicles which are thousands of times smaller than the width of a human hair. Furthermore, it requires a process to streamline obtaining these images for a whole-brain which even for that of a tiny fruit fly numbers in the tens of millions.
To tackle the image resolution problem, scientists use electron microscopy (EM). Whereas the resolution of typical light microscopy is restricted by the diffraction limit to several hundred nanometers, electron microscopes can resolve features of samples at the nanometer level. This makes it ideal for analyzing slices of brain tissue. In EM, electrons are used instead of photons and are shot in a concentrated beam at a sample. EM images can be categorized into two fundamental approaches: Transmission Electron Microscopy (TEM) and Scanning Electron Microscopy (SEM). In TEM, sections of cerebral tissue ~70nm thick are sectioned using a diamond knife and loaded onto an electron transparent grid. Electrons are then fired at the sample and pass through after which they encounter a phosphor plate. When the electron collides with the plate, energy is released and detected by a CCD camera array which gradually composes an image of the sample. The interactions and energy released in this collision are dependent on the scattering and loss of energy of the electron as it interacts with the sample (Figure 2a). SEM utilizes the same principles except instead of electrons passing through the sample, they bounce off and are detected from above (Figure 2b).
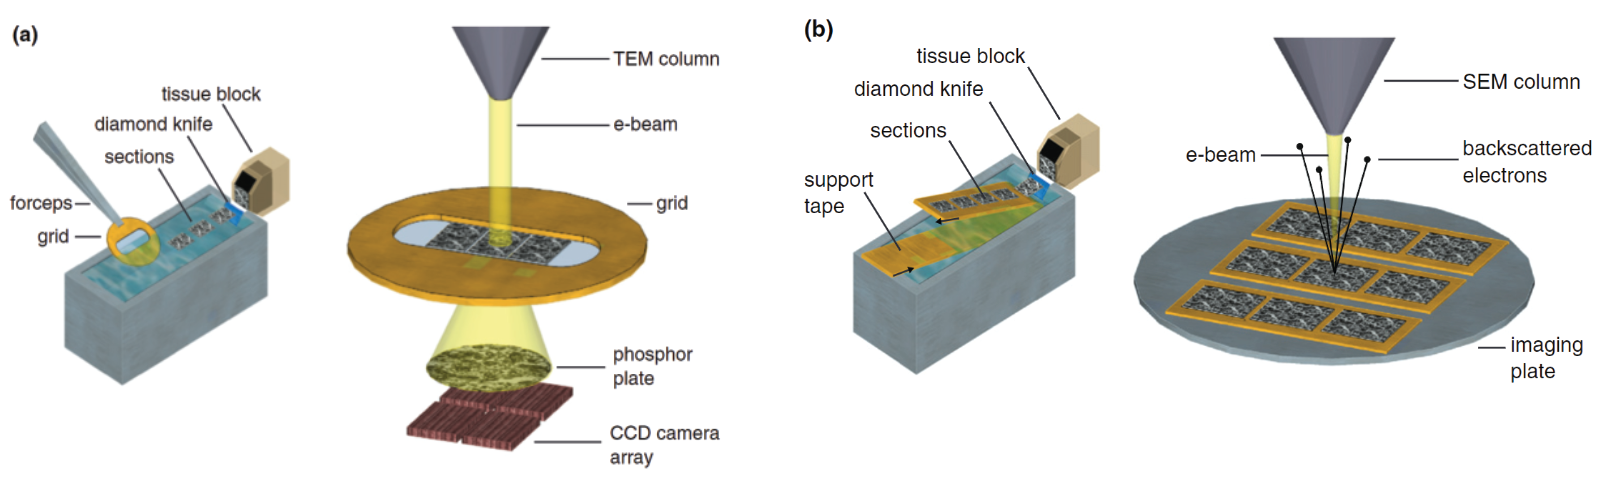
Although both SEM and TEM can be used for connectomics, TEM typically requires manual intervention to load the slices which introduces human error and is impractical for high throughput imaging. Using SEM, however, scientists have developed means of automating much of the slicing, collecting, and imaging process. One of these innovations is called the Automated Tape-Collecting Ultramicrotome (ATUM). Fundamentally, the ATUM automates the sectioning and imaging process by slicing sections of cerebral tissue and collecting them on a strip of tape like a conveyor belt. Like an old film reel, each strip contains a sequence of slices that, frame by frame, tell the story of that area of the brain. The ATUM takes a sample of the brain that has been prepared for EM by being dehydrated and embedded in a resin. This sample is then mounted onto the ultramicrotome outfitted with a diamond knife. The sample slides against this knife to generate extraordinarily thin sections which are then collected by Kapton tape and mounted onto wafers for further sample preparation and eventual EM imaging. Although sectioning and slice collection has become a rapid process, image acquisition has become a rate-limiting step for obtaining connectomes from larger volumes of brain tissue. Technological innovations which improve the acquisition rate have been made. These include parallelizing multiple electron beams in a single column to enhance the number of backscattered electrons.
Image processing and analysis also impose a bottleneck on the rate of acquiring connectomic data. This is primarily due to the enormous quantity of data held in small volumes of brain tissue. For example, one cubic millimeter of mouse cortex holds approximately two million gigabytes of data. The human neocortex alone would have that amount of data five hundred thousand times over. When the connectome for C. elegans was mapped, tracing of neurons over successive slices (carving out the cake) was performed manually. To do the same for larger brain volumes would likely necessitate centuries of human hours. This obviates the need for AI-mediated data analysis.
Automated image analysis
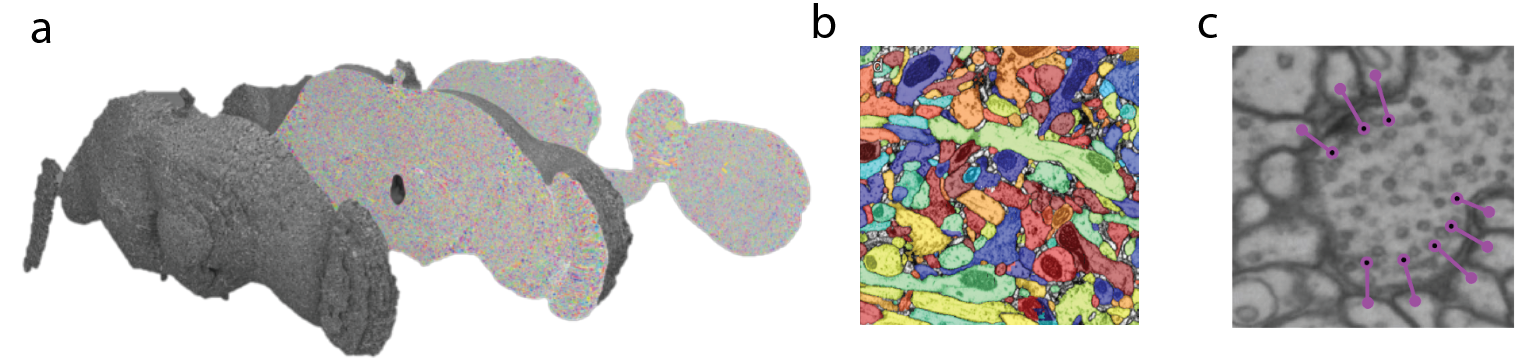
The three primary post-processing steps include image alignment and stitching, neuronal segmentation, and feature detection. When the full EM volume for the fly brain was developed and published, millions of images needed to be stitched in XY dimension to form mosaics of the whole brain slice like pieces of a puzzle and aligned across slices to generate a contiguous volume. The scientists developed computational tools to automatically stitch and align images and to correct for distortions. The result was a volume of the fly brain imaged at nanoscale resolution (Figure 3A).
Now that this dataset is acquired, deep learning algorithms were used to segment the plasma membranes of cells from one another, akin to filling in a giant coloring book (Figure 3B). Several approaches have been taken to achieve this. Sebastian Seung’s group at Princeton University applied an approach where a model was trained to classify pixels as part of the plasma membrane or not, after which a watershed algorithm over-segments the sample to create what they call ‘super voxels’. These super voxels could then be reconstituted according to affinity matrices to fill in a putative neuron. The connectome of the hemibrain of the fruit fly, a massive multi-lab international effort, utilized cycle generative adversarial networks to generalize image quality and similarity across slices and then used a flood filling network trained on voxel data to segment out neurons in the volume.
Beyond neuronal reconstruction, detecting synaptic connections is critical to the formation of complete connectomes. Several groups have explored methods to automate synapse detection. With the nanoscale resolution of EM, pre- and post- synaptic specializations and machinery like T-bars, vesicles, postsynaptic densities, and synaptic clefts can be used to identify and deduce synapses. One group working with the aforementioned full EM volume of the fly brain developed an approach that uses convolutional neural networks (CNNs) to predict the presence of synaptic clefts and T-bars after which the identity of the connected neurons are resolved and assigned (Figure 3C).
Although these models are extraordinarily accurate at segmenting neurons and generating 3D reconstructions, errors still occur. For example, branches of neurons might be lost, or two neurons might be treated as one. These sorts of errors often require human correction. Finding and fixing all such errors would be a steep task for even a large lab. However, what if you could outsource this task over a distributed network of people? That is the spirit of Flywire, which is a crowdsourcing platform to map the connectome where users from across the world can join. For example, if one group is interested in a subpopulation of neurons, they can access the dataset, find their neurons of interest, and proofread that population to extract interesting information from it. This way the dataset becomes progressively more refined with human error corrections and groups can utilize this valuable connectomic data to advance their science.
How are connectomes enhancing our understanding of the brain?
Connectomic level understanding of neural circuits derived from these data sets is already proving useful for scientific discovery. Work from the Murthy lab at Princeton used Flywire to identify a specific neuron that controlled the social state of the female. They were able to link the natural physiological response of this neuron to the wiring patterns of the correlate for this neuron in the connectome. Thus, they were able to link together behavior, activity, and architecture. The result is a deep chain of understanding how neural circuits generate contextually relevant behaviors across time. Principally similar work in mice followed the detailed activity patterns of the mouse visual cortex. These same neurons were mapped onto the EM volume and neural reconstruction of that region, integrating our understanding of a neuron’s function and wiring.
The road ahead: scaling and speeding up
The above two tales of the use of connectomics underscore a key direction the field is headed in; linking neuronal function with structure. As our ability to functionally interrogate neural circuits improves in tandem with our ability to rapidly acquire connectomes, so will our understanding of the brain and its secrets.
The road ahead for connectomics is long but ripe with possibility and we are accelerating in pace down it. Even faster methods for EM imaging are being developed and the predictive power of AI is improving in parallel each year. The hope for a future filled with the connectomes of larger brains is becoming increasingly realistic. Ultimately, however, this hope is hinged upon the scientific community’s ability to take a concerted effort on this problem. EM reconstructions have brought together engineers, computer scientists, and experts in microscopy. Continuing to organize and expand the collaborations that have brought us here will take us all the way.