
Imagine you are behind the camera framing a picture of your friend. Where you stand, you notice that although you are capturing much of the background, your friend is far away and consequently they appear blurry. To adjust for this, you move in closer and snap the perfect picture. What did you just do? You decreased the distance between the camera sensor and the subject, such that now each pixel occupies less surface area and thus represents finer information. This provides a useful framework for conceptualizing resolution, which measures how many pixels there are and how much information each pixel encodes. A paramount goal in the field of microscopy is to image increasingly smaller things at increasing degrees of resolution. How can we do this?
Mathematically, the resolution is a function of the numerical aperture of the optical system and the wavelength of the light you are collecting (figure 1). The resolution of this system, however, is limited by its diffraction limit which is a result of how light bends due to its wave properties. In our thought experiment, the subject grew in the frame by becoming closer to the sensor. High-resolution microscopes, however, are already incredibly close to the sample. What if instead, we could literally grow the sample itself like consuming a super mushroom in Mario Bros? Scientists have developed a method whereby this is possible, and it is called Expansion Microscopy (ExM). In this article, I will discuss how it works and how scientists are using it to cheat the diffraction limit and peer into previously inaccessible nanoscopic worlds.
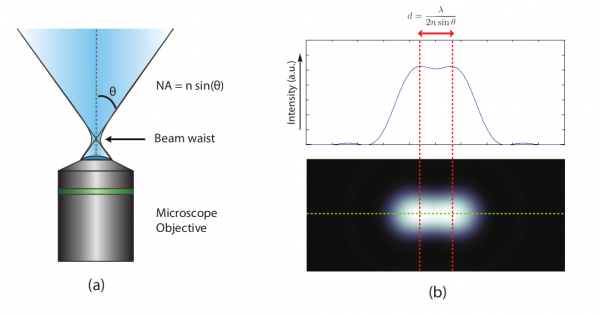
Table of Contents
1. What is Expansion Microscopy and how does it work?
2. How is Expansion Microscopy being used in fields like neuroscience and pathology?
3. How can AI integrate into the workflow of high-resolution imaging afforded by Expansion Microscopy?
Expansion Microscopy deploys hydrogel chemistry to isotropically expand biological tissues
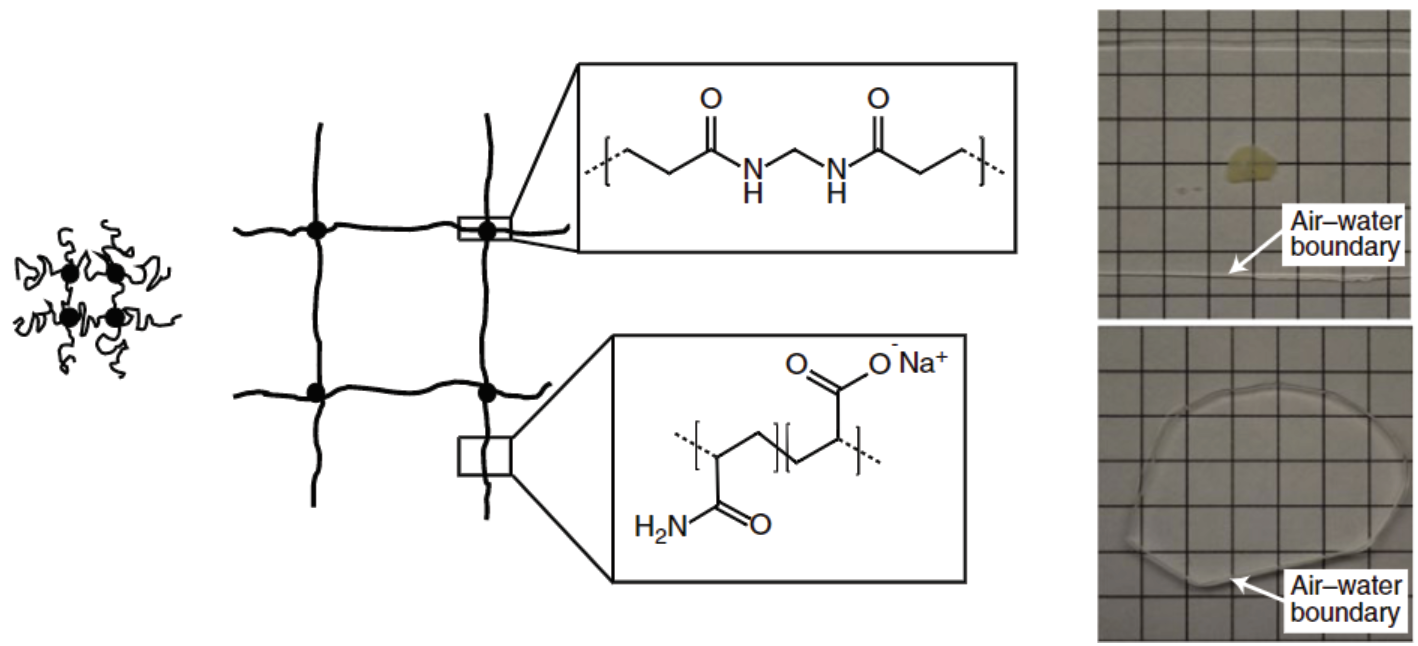
Polyelectrolyte gels are composed of crosslinked polymers that form a grid network. One property of these gels is that under certain environmental conditions, like being placed in water, they can swell. At the molecular level, this is caused by the isotropic expansion of the polymer network (Figure 2). The general strategy of ExM, developed by Ed Boyden’s group at MIT, is to apply this principle to biological tissues through a series of chemical infusions and treatments which alter the properties of the tissue while preserving the cellular and protein structure. What are these steps and how do they work?
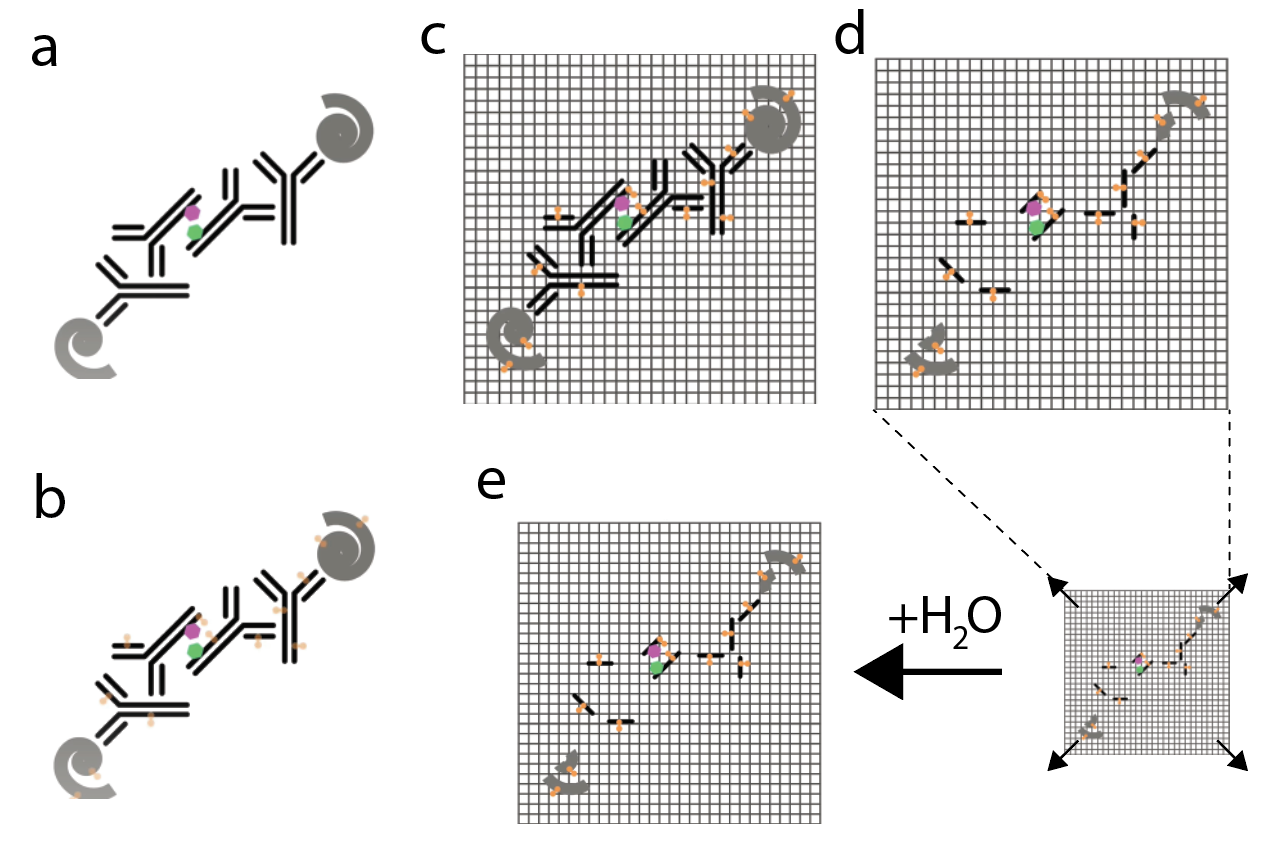
1. Labeling: Attaching an imaging probe to your proteins of interest for eventual visualization during imaging (Figure 3a)
Labeling is typically performed using general immunostaining methods. In immunostaining, antibodies are iteratively used to target proteins of interest. Initially, the primary antibody is used to bind to your protein of interest. Next, a secondary antibody that is specific to the primary is added to the sample. The secondary antibody is conjugated to a fluorophore which can be probed during microscopy. This way you can visualize the spatial distribution of that protein. Intermediate steps within labeling include washing out unbound antibodies and ‘blocking’ the sample with protein to minimize nonspecific antibody binding.
2. Anchoring: Covalently linking your imaging probe to the expansion gel itself such that can be embedded in the cross-linked network (Figure 3b)
In the anchoring step, a compound called Acryloyl-X (AcX) is used to treat the sample. AcX reacts with the amine groups on the amino acids of proteins to create a chemical modification that behaves as an anchor. This will permit linkage to the polymer network in the subsequent polymerization step.
3. Polymerization: Casting the sample in a monomer solution which reacts to form the cross-linked network (Figure 3c)
A monomer solution of sodium acrylate and dimethylacrylamide (DMAA) is added to the sample. This undergoes free-radical polymerization to form a gel matrix that links with the anchors from the previous step.
4. Homogenization: Disrupting the mechanical structure of the sample to enable isotropic expansion (Figure 3d)
Since the relative density of protein in the tissue is not uniform, the rate of expansion across regions is inconsistent and could lead to rupturing and damaging of the sample. To circumvent this, the sample has to be homogenized, which is achieved by slicing up the proteins. This is done through a process called digestion which includes treating the sample with a proteolytic enzyme called proteinase K. Another method to homogenize the sample without proteolysis is by heating the sample. This causes the proteins to denature, which overrides the steric interactions which produce the tertiary structure of proteins, causing them to unfold.
5. Expansion: Isotropically expanding the gel matrix and the sample (Figure 3e)
Deionized water is added to the sample which is now encased in a gel. Osmotic force drives the water into the gel which stretches the fabric of the interwoven polyacrylate network and thus isotropically expands your sample.
Now your sample has at least quintupled in size! What this has done is separate fluorophores in space such that features of a cell that are close together are now far enough apart to disambiguate during typical microscopy methods. This means that you can supersede the diffraction limit proportional to your expansion factor. For instance, if your microscope has a diffraction limit of 500 nm, following expansion microscopy you would have an effective resolution of under 100 nm.
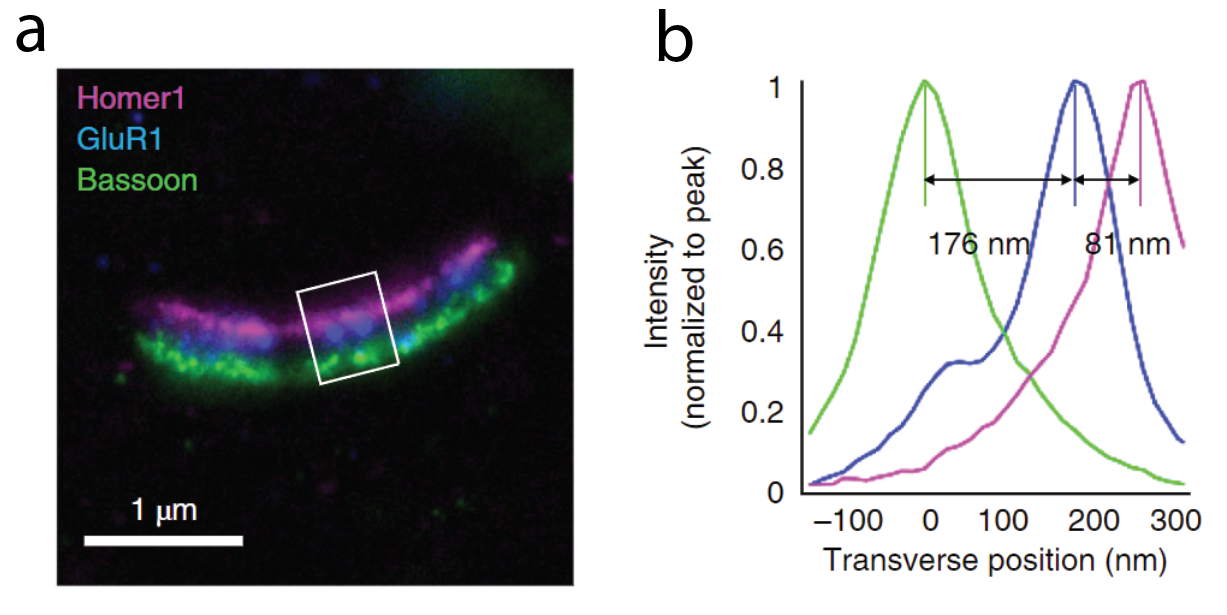
Although the protocol I described above provides a general scaffold for the strategy of ExM, alternate versions of this method that improve usability, expansion, and versatility have been developed. For example, iterative expansion microscopy (iExM) includes two rounds of expansion whereby the polymers in the first gel can be cleaved and a second gel can be introduced. This allows for sub 30 nm resolution. This is small enough to spatially resolve the structure of individual synapses, which are the quantal units of neuronal connections (Figure 4). Furthermore, instead of probing proteins, some scientists have integrated the use of labels for other biological molecules like RNA. This class of ExM uses FISH methods or RNA fluorescence in situ hybridization. Synergizing FISH methods with ExM enables improved subcellular localization and quantification of specified sequences of RNA. How is this marginal improvement in the optical resolution of biological samples being used?
Expansion Microscopy is being used to identify nanoscopic cellular features in neuroscience and pathology
Ed Boyden’s group at MIT, the same group which published the original iteration of ExM, applied this method to the field of Pathology. Kidney Minimal Change Disease (MCD) is characterized by proteinuria where the kidney filters out proteins in the blood which would normally remain in circulation. Histologically, this can be diagnosed by examining the foot processes epithelial cells which line the glomeruli of capillaries. Usually, these processes are too small to image optically and require the use of electron microscopy to resolve. With Expansion Pathology (ExPath: coined to denote the use of ExM for pathology), glomeruli can be expanded to achieve high enough resolution to visualize foot processes and diagnose MCD.
ExM has also proven helpful in the field of neuroscience. In work from David Fitzpatrick’s group at the Max Planck Institute for Neuroscience, scientists used ExM to visualize the organization of dendritic inputs on neurons in the primary visual cortex. Diffraction-limited optical methods are usually unable to resolve the nanoscale morphology of synapses. Using ExM, the scientists were able to map the spatial organization of dendrites who were receiving input from a specific type of neuron and were able to identify cell type specific patterns. How are scientists capitalizing on ExM by integrating it with machine learning?
AI-mediated segmentation and classification of expanded tissues open new doors for histological analysis and diagnostics.
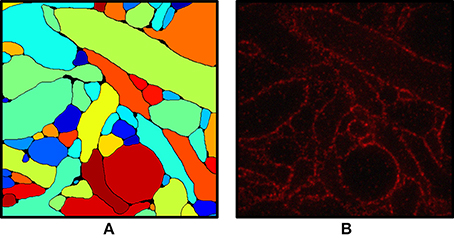
One application is to segment the plasma membranes of cells in sections. In 2D sections, morphometric units for neurons and other cell types like cross-sectional area can be extracted. With multiple sections in series, these segmentations can build three-dimensional reconstructions of the neuron. Following the improved spatial resolution of expanding neuronal tissue, scientists from Adam Marbelstone and Ed Boyden’s group trained a convolutional neural network to classify either pixels as part of the cell boundary or intracellular space. Then, model performance can be visualized by reporting the probability map of all pixels (Figure 5). Another application in the field of pathology is to improve the computational diagnosis of preinvasive breast lesions. Human classification is heavily inconsistent, and scientists aimed to demonstrate that the improved spatial resolution conferred by ExM combined with computational classification could greatly advance diagnostic efforts. Scientists accomplished this by training a network to segment nuclei and then extract nuclear features such as intensity, texture, and morphology. Armed with this precise information, diagnostic accuracy was an incredibly 95% which for atypical ductal hyperplasia was over 20% better in expanded samples than unexpanded.
If any of the above segmentation and classification methods could be applied to your research, Biodock delivers custom AI modules for fluorescent cell segmentation. Detection includes but is not limited to, nuclei, cell boundaries, and even precise histological features. Request a brochure to see all the services Biodock has to offer and how we can accelerate your science!
Conclusions
Taken together, Expansion Microscopy is an innovative tool that is reshaping our understanding of the world at the nanoscale. Improvements to the method that enhance the expansion factor and broaden its accessibility are currently underway. Critical applications in neuroscience and histology are already being made. Finally, by harnessing the power of artificial intelligence, we will be able to train machines to interpret the high-dimensional information ExM allows us to obtain.