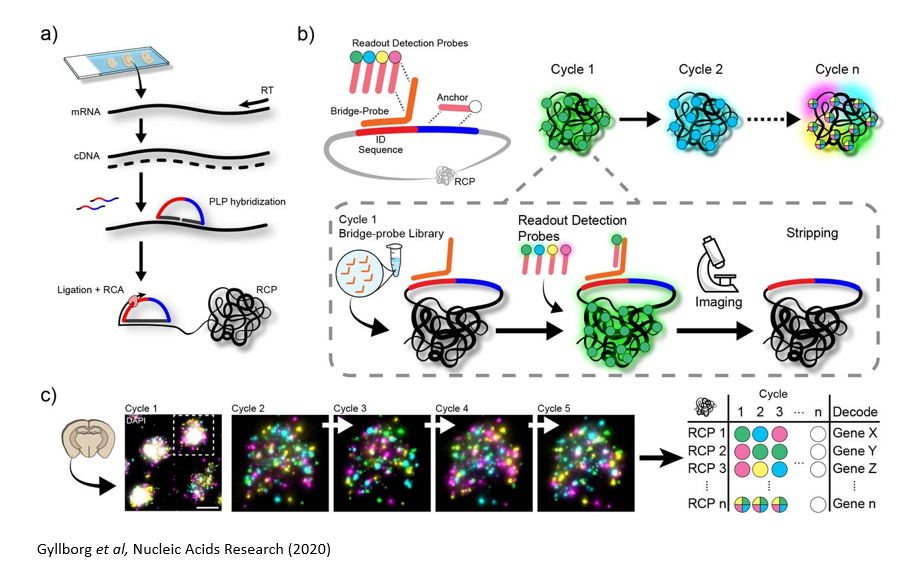
Imagine you’ve just finished up a jigsaw puzzle. Time to put it back in the box: take it all apart, and the image that had come together is lost. What if you had to assemble that puzzle again, and instead of using the individual pieces, you were given a list of colors in each puzzle piece as your only information. Could you put it back together again? It may be possible, but would require a lot of guesswork and uncertainty. You might have guessed where this analogy is going: single-cell RNA sequencing (scRNAseq), the wildly popular method for generating transcriptomic information for individual cells, involves pulling apart tissues and losing the positional information of individual cells. After several decades of scRNAseq-based biological exploration, we now understand that heterogeneity—within cell types previously thought fairly uniform, or even clonal cell populations—is the norm rather than the exception.
Countless factors influence the global state of an individual cell and pull the cellular response in unpredictable directions. The spatial context of a cell—where it lies in the tissue and what other cells are around it—was hypothesized to be an important mediator of cell state decisions, and has since been confirmed to be a critical dimension in understanding cellular behavior and higher-order tissue architecture. Spatial sequencing, to complete the analogy, allows us to see the completed puzzle. However, fully spatially resolved single-cell transcriptomes are not yet possible. The current level of resolution is on the order of 10-100 microns, and the number of genes captured does not yet rival scRNAseq. As technological innovation continues, it is likely that we will see each of the parameters improved. In the meantime, many researchers have found great success in combining spatial and traditional next-generation sequencing, leveraging the advantages of each approach to obtain a fuller picture of the biology of different organ systems and disease states. In this article, we'll cover the following topics:
- An overview of the different spatial sequencing methods currently available
- Analysis approaches and challenges for spatial data
- Methods for integrating single cell and spatial transcriptomics
Methods in Spatial Transcriptomics
In general, the research community lumps the many approaches to spatial sequencing into a few categories. Broadly, imaging-based methods can achieve high resolution but are limited in number of genes captured, while next-generation-sequencing-based methods can capture entire transcriptomes but currently have limited resolution. For a more technical discussion of the methods described below, take a look at this review or this one. Computational spatial reconstruction, which involves imputing the spatial information in a non-spatially-resolved scRNAseq dataset, is sometimes also considered a spatial method but will not be discussed here.
Microdissection-based Approaches
This set of protocols has in common physical separation of areas of interest. Laser-capture microdissection of 1-10 cells followed by RNAseq was the first such method described. LCM-seq, GEO-seq, and tomo-seq are all based on microdissection (and the related technique of cryosectioning) as a method of preserving the spatial location of the cells being sequenced. Despite the high number of unique genes captured by these techniques (on the order of 10,000 genes), the throughput is low due to the labor-intensive microdissection process.
FISH-based Approaches
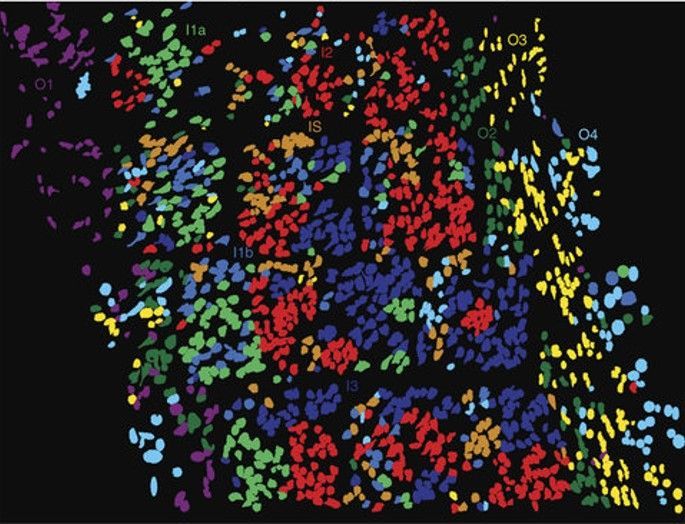
As the header suggests, this suite of methods represents an evolution of the relatively old RNA fluorescence in situ hybridization (RNA-FISH) technique. Using fluorescently labelled oligonucleotide probes complementary to a target RNA sequence, FISH uses confocal microscopy to visualize RNA expression across a fixed tissue sample. Previously, this approach had been limited by the number of individual fluorophores that could be distinguished by microscopy. A key workaround has been the development of multiple rounds of hybridization and washing, allowing the user to image the same tissue section many times with a large number of probes. SeqFISH, the most popular application of this method, can allow the user to evaluate expression of up to 10,000 genes. A commercial implementation of FISH-based transcriptomics, RNAscope, is also available for imaging 4 different genes at once. A remaining limitation of FISH-based transcriptomics is the need to synthesize thousands of unique probes—multiple per gene—and requires prior knowledge of the genes targeted. In addition, sequential rounds of confocal imaging produce very large data volumes that must be processed, analyzed and stored.
In situ Sequencing Approaches
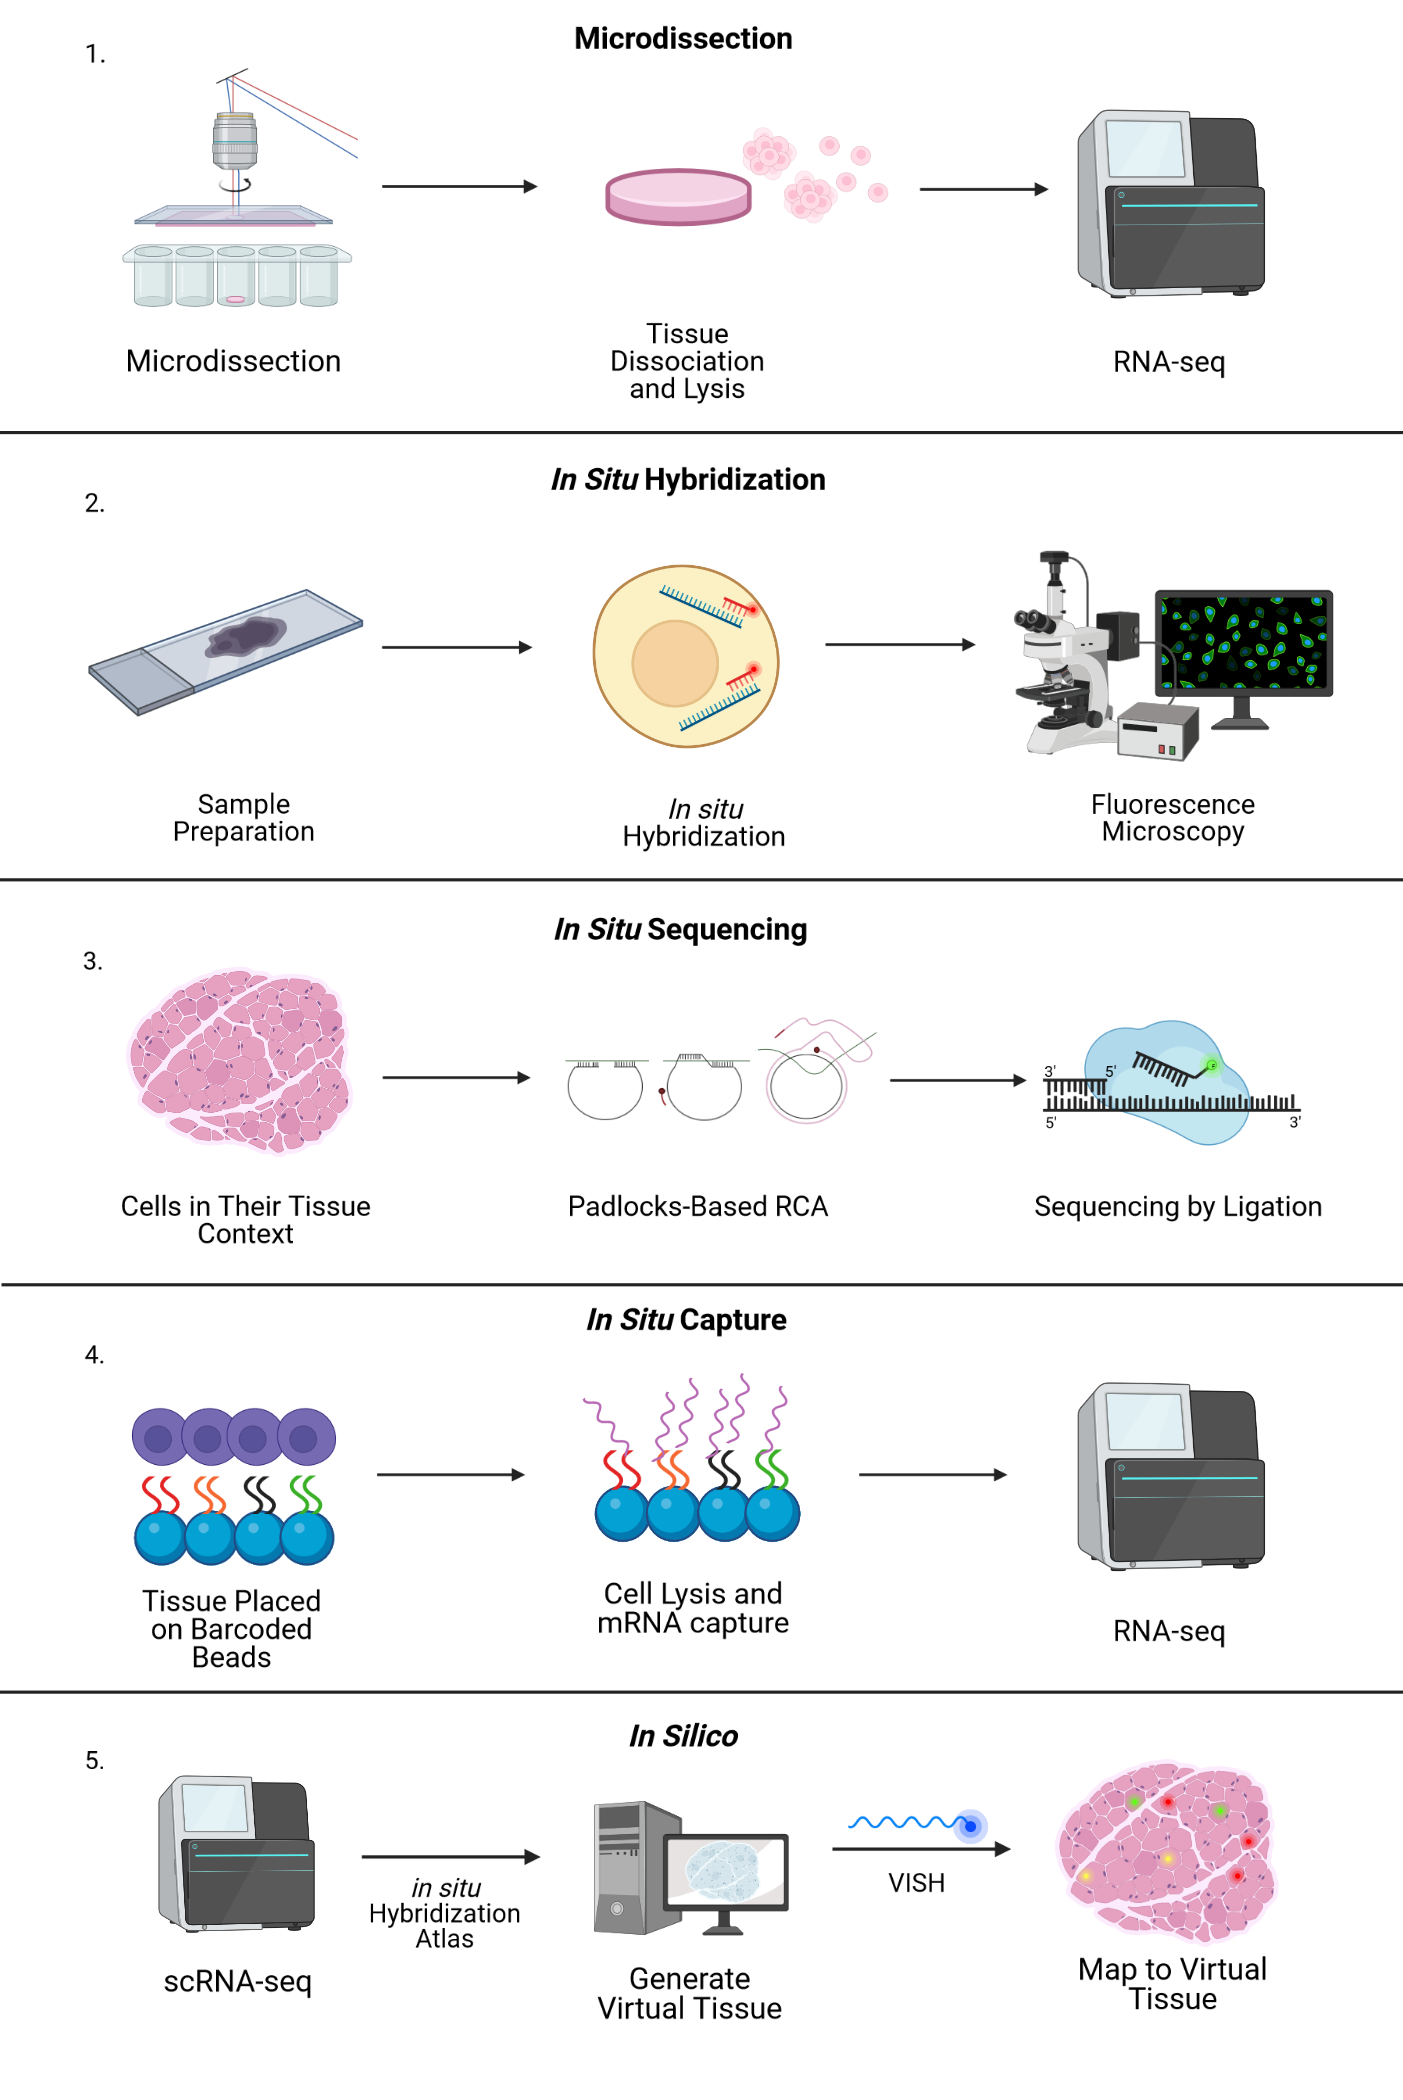
In situ sequencing refers to running a next-generation sequencing reaction on single cells within a tissue sample. In one such approach, in situ sequencing using padlock probes, single mRNA molecules are amplified using engineered DNA probes. Briefly, transcripts are reverse transcribed into cDNA, and padlock probes hybridize to cDNA strands and form a DNA circle. This DNA circle is amplified and undergoes sequencing-by-ligation, followed by imaging where different colors correspond to different base pairs. Other related methods in this category include barcode in situ targeted sequencing (BaristaSeq), spatially resolved transcript amplicon readout mapping (STARmap), and fluorescent in situ RNA sequencing (FISSEQ). The major drawback of these approaches is the physical limitation of amplifying many transcripts within a single cell (molecular crowding), but new expansion sequencing methods such as ExSeq which combine expansion microscopy with in situ sequencing are redefining the boundaries.
In situ Capture Approaches
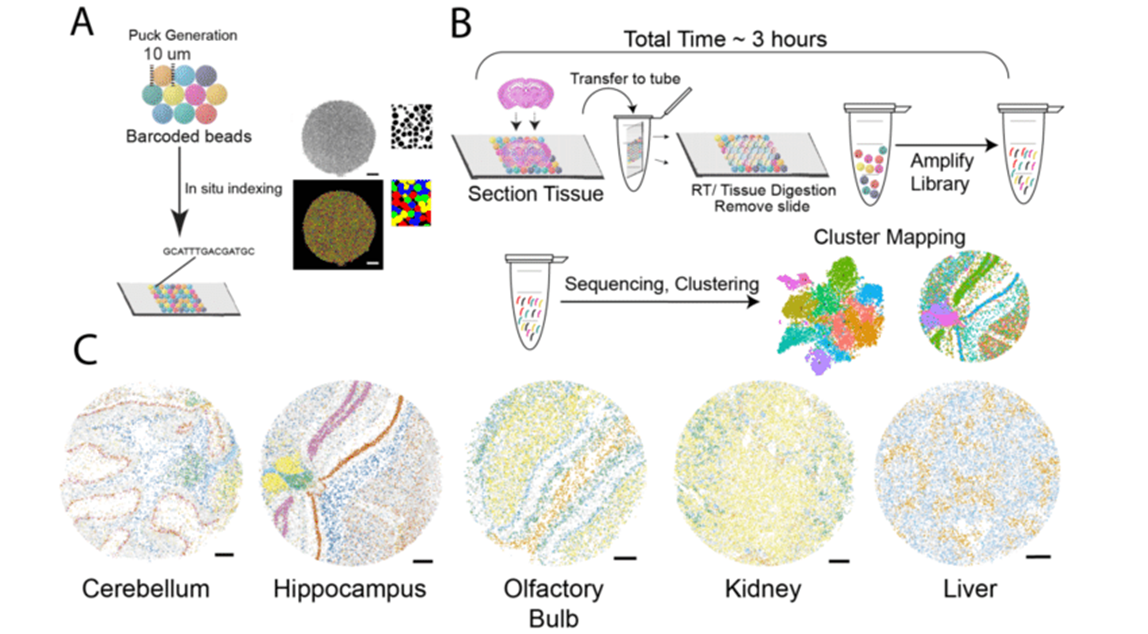
Another type of in situ approach is based on using DNA probes affixed to a solid matrix such as a slide to capture individual transcripts and deliver them into microwells, followed by RNAseq. The company Spatial Transcriptomics (now part of 10x Genomics) commercialized this method, using one unique barcode per microwell to preserve spatial information and a generalized capture probe that binds poly-A tails. Spatial Transcriptomics’ technology was further developed by 10x Genomics as the Visium platform, with increased sensitivity and throughput. This approach has an average of 1-10 cell resolution (so not quite single-cell), and has been shown to capture on the order of 5000 genes. Slide-seq uses a similar premise, layering barcoded microparticles on a glass coverslip which capture and tag transcripts. The beads are then pooled together for RNAseq and later mapped back to spatial coordinates based on the known barcodes. The resolution achieved in Slide-seq is near single cell (approaching 10 microns), and captures an average of 500 genes per cell.
Challenges in Analyzing Spatial Sequencing Data
An important consideration when choosing which spatial sequencing approach to use is that of analysis feasibility: many of the methods described above require processing with software that was not designed for community usage, and may be quite limited in scope to the initial questions asked by the originating research group. Some commercial entities are developing software and some labs are working on unified pipelines, but as it stands there is no one-size-fits-all solution for spatial sequencing experiments . In addition, the types of questions that can be asked of spatial data require new analysis methods to be developed, and potentially some DIY implementation for an individual researcher. For example, groups have described methods to identify gene-specific spatial variation (see also this method, this one, or this one), as well as gene expression hotspots and gene-gene interactions. Another major methods development focus is identifying, quantifying, and applying statistical tools to cell-cell interaction networks. Finally, cell segmentation remains a challenge for both imaging-based and next generation sequencing-based methods. Imaging-based methods such as SeqFISH can achieve high resolution, and this type of imaging dataset can work well with existing cell segmentation methods. However, for cells with complex morphologies such as neurons these methods are not reliable. On the other hand, sequencing-based approaches where position information is assigned computationally, resolution is lower than single-cell and transcripts from multiple cells may be captured in the same pixel. Methods to deconvolute mixed pixels use reference single-cell transcriptomic profiles to tag possible multiple-cell mixtures.
Integrating Single Cell RNAseq and Spatial Transcriptomics Datasets
Many groups have chosen to combine scRNAseq and spatial sequencing in order to benefit from the unique information delivered by these two approaches. One important caveat here is that currently all scRNAseq and spatial sequencing methods destroy the tissue being analyzed, meaning that we cannot obtain a complete unbiased transcriptome and positional information from the same cell. However, datasets obtained from the same tissue or different parts of the same sample can be fused computationally through several methods. Seurat, the very popular scRNAseq analysis package, has this functionality, and other groups have implemented a hidden Markov model approach. A third approach has also been reported, which involves generating a reference spatial gene expression atlas onto which scRNAseq-captured cells can be mapped. Going the other way, pciSeq is a method for leveraging scRNAseq data to identify cell types in tissues imaged via spatial transcriptomics techniques where the gene number captured is relatively modest.
An example of this integrated approach was recently published by Lohoff et al. in Nature Biotechnology. The authors used both SeqFISH and scRNAseq on tissue sections of a developing mouse embryo to characterize cells types and gene expression patterns over time. Specifically, a panel of 387 marker genes for cell-typing was developed on the basis of an existing scRNAseq atlas covering mouse development. Next, SeqFISH with probes specific to those ~400 genes was performed on embryo sections at the 8-12 somite stage. The FISH images were segmented into individual cells, and each cell was identified on the basis of marker genes. Then, the SeqFISH dataset was integrated with the existing mouse atlas to allow imputation of transcriptomic expression across the embryo sections. Imputation was done by analyzing the SeqFISH expression profile of each cell and matching it to the most similar transcriptome from the scRNAseq atlas. This approach was validated by leaving out SeqFISH-measured genes in imputed cells and comparing the true and imputed values, which showed good accuracy in expression prediction. The authors then illustrated the utility of this 10,000-gene spatial atlas by focusing on the development of the nascent gut tube. They report a previous undescribed dorsal-ventral gene expression patterning axis which may drive the decision-making of embryonic cells towards either the esophagus or the lung/trachea.
Choosing which one of these approaches to use for your own experiments may not be straightforward– considerations of sample/tissue size, available equipment, cost considerations, and transcriptomic depth and resolution needed are all factors to consider. When it comes to analysis, consider using Biodock for some or all of the work of data storage and access, cell segmentation, and custom analysis pipelines!